
Real-Time Analytics Benchmark: Apache Iggy vs Kafka into VeloDB Cloud
A VeloDB benchmark shows why broker architecture matters for query-ready streaming analytics: Iggy delivered roughly 3x broker throughput, 16x lower broker p99 latency, and a much tighter end-to-end tail.


Most streaming benchmarks stop at the broker. That is useful, but it is not the whole story for real-time analytics.
The thing users actually feel is not "messages accepted by a broker." It is when an event becomes queryable, when a dashboard reflects the new state, when an alert has enough fresh context to fire, or when an application can make a decision from data that just arrived.
That is why the recent VeloDB benchmark for Apache Iggy and Kafka is interesting. It measures two layers:
- Layer 1: broker-only throughput and latency.
- Layer 2: end-to-end latency from event creation through broker, connector, VeloDB Stream Load, and queryable row.
The benchmark keeps the workload, region, payload, hardware class, target table, and analytics backend fixed. The broker and connector path are the variables. That makes it a useful case study in a question that comes up often: when you replace a traditional broker with a latency-first engine, how much of that advantage survives contact with the rest of the ingestion pipeline?
The short answer: the broker advantage is large, and the end-to-end advantage shows up where it matters most, in the tail.
The setup
The benchmark sends clickstream events into VeloDB Cloud through two comparable pipelines:
| Pipeline | Broker | Connector path | Analytics backend |
|---|---|---|---|
| Iggy to VeloDB | Apache Iggy | Iggy connector to VeloDB Stream Load | VeloDB Cloud |
| Kafka to VeloDB | Apache Kafka | Kafka Connect Doris sink to VeloDB Stream Load | VeloDB Cloud |
The workload is intentionally realistic rather than synthetic-only. Layer 2 uses nested clickstream JSON with fields such as device_info, event_properties, and utm_params, streamed at a steady 2,000 events per second. Each event carries its creation timestamp, and VeloDB stamps ingest_time when the row becomes queryable. The latency query compares those two timestamps inside VeloDB.
The hardware is also disclosed:
| Role | Instance | Notes |
|---|---|---|
| Streaming broker | AWS EC2 c6id.4xlarge | 16 vCPU, 32 GB memory, local NVMe |
| Event source | AWS EC2 c7i.2xlarge | 8 vCPU, 16 GB memory |
| Analytics backend | VeloDB Cloud | 4-core FE demo configuration |
Everything runs in AWS us-east-1. The broker runs are back-to-back on the same machine.
That last detail matters. Benchmarks often become arguments about benchmark shape. This one is explicit about the shape: same workload, same target table, same region, same hardware, same VeloDB backend, and standard connector paths for each broker.
Layer 1: raw broker capability
First, the benchmark isolates the broker. No database. No connector. Just sustained broker throughput and latency with 256-byte messages, batches of 1,000, and 8 parallel producers.
| Metric | Iggy | Kafka |
|---|---|---|
| Throughput | 1,232 MB/s | 371 MB/s |
| Messages per second | 4.81M | 1.52M |
| p50 latency | 1.7 ms | 3 ms |
| p99 latency | 2.5 ms | ~40 ms |
| p99.9 latency | 2.8 ms | ~80 ms |
The headline is straightforward: Iggy delivered roughly 3x the throughput and about 16x lower p99 latency than Kafka in this broker-only run.
The more important number is the shape of the tail. Iggy held p99.9 at about 2.8 ms. Kafka reached roughly 80 ms at p99.9. For systems that coordinate real-time analytics, alerts, operational automation, or agentic workflows, that difference is not cosmetic. It changes how much uncertainty the rest of the pipeline has to absorb.
Why Iggy behaves differently
Iggy is built around a thread-per-core, shared-nothing execution model. Each core owns a shard and does useful work without cross-core locking on the hot path. It is also native Rust, so there is no JVM garbage collector sitting in the latency profile.
The other major piece is io_uring. Instead of paying for a syscall per network or disk operation, Iggy submits and completes I/O through per-core ring buffers shared with the kernel. The benchmark ran Iggy as a raw binary with local NVMe, XFS, hugepages, mimalloc, and a mainline Linux kernel configured for Iggy's io_uring path.
That sounds low-level because it is. But the practical consequence is simple: the broker spends less time coordinating around itself.
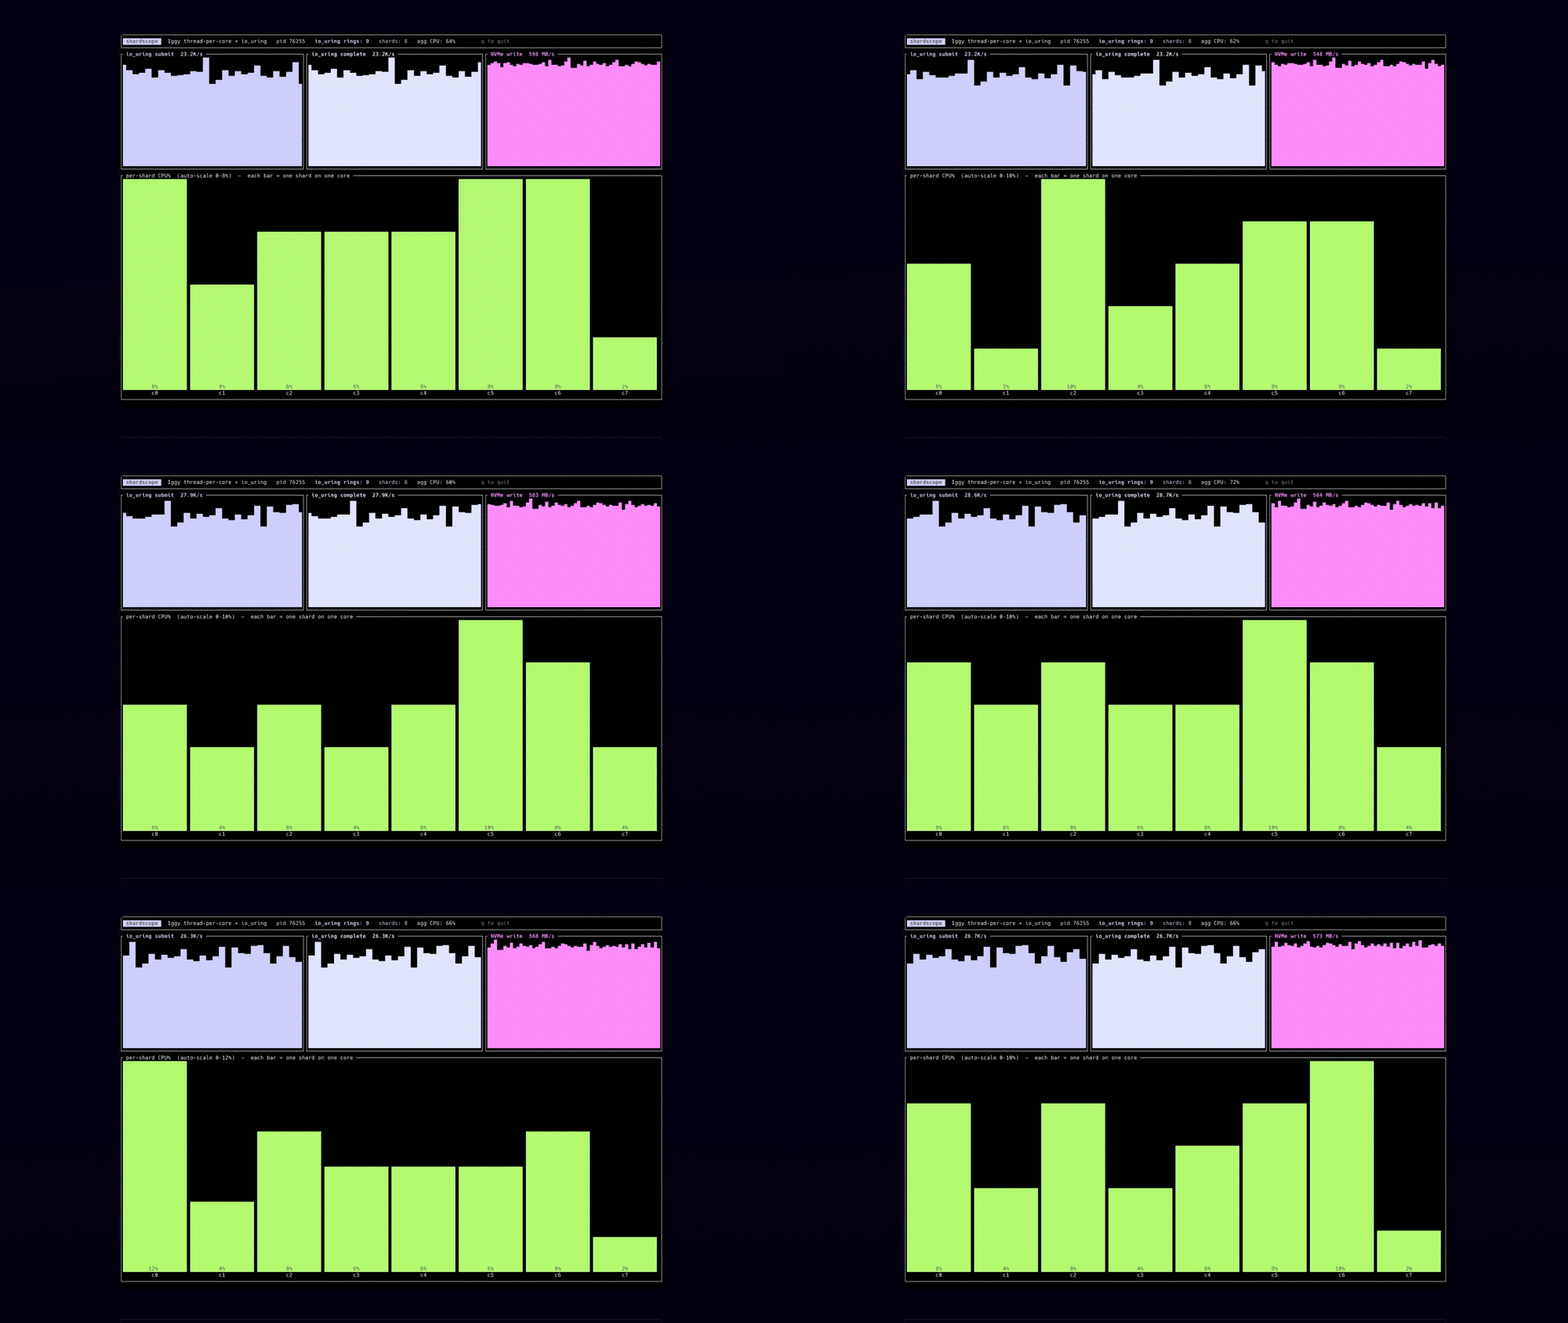
This is the part of the architecture that matters for tail latency. A broker can have good average latency while still injecting periodic stalls into the pipeline. Iggy's design is aimed at making that tail predictable under load.
Layer 2: event to queryable row
Layer 2 is the more useful test for real-time analytics. It measures the full path:
event -> broker -> connector -> VeloDB Stream Load -> queryable rowAt 2,000 events per second, both connector paths kept up with the workload. That means the measurement is not a backlog test. It is a steady-state freshness test.
Here are the end-to-end results:
| Percentile | Iggy to VeloDB | Kafka to VeloDB |
|---|---|---|
| p50 | 577 ms | 789 ms |
| p90 | 1,011 ms | 1,646 ms |
| p99 | 1,232 ms | 3,588 ms |
| p99.9 | 1,346 ms | 10,022 ms |
| max | 1,412 ms | 10,247 ms |
The median story is useful, but not decisive. Both pipelines are in the sub-second range at p50, and both medians are largely shaped by connector flush behavior.
The tail is decisive.
The Iggy pipeline stayed near 1.3 seconds at p99.9 and topped out at 1.4 seconds. The Kafka pipeline reached roughly 10 seconds at p99.9 and max. That is about a 7x heavier end-to-end tail for Kafka in this benchmark.
This is the result that matters for production systems. Real-time analytics does not fail only when the average gets bad. It fails when freshness becomes unpredictable, when the 99th percentile silently becomes the user experience for the workflow that happens to land in the wrong window.
VeloDB was not the bottleneck
One of the cleaner findings in the write-up is that VeloDB was not the limiting factor in this run. The benchmark used a modest 4-core VeloDB FE demo configuration, and a single Stream Load commit completed in roughly 170 ms with headroom above the test rate.
The end-to-end latency was dominated by connector micro-batch cadence and broker behavior, not by VeloDB ingest capacity.
That distinction matters. If the database is saturated, broker comparisons get muddy. Here, the backend had room, so the pipeline exposed the difference between a low-tail broker path and a coarser commit-batched connector path.
The write-up also notes that VeloDB can scale vertically and horizontally into the 10 to 30 million rows per second range, or 60 to 90 GB/s, when scaled out. This test was not trying to find that ceiling. It was testing query-ready freshness on a realistic streaming path.
What this means for streaming analytics teams
The lesson is not simply "one broker is faster." The more useful lesson is that broker architecture still matters even when the real application includes connectors, database commits, and queryable storage.
For dashboards, observability pipelines, personalization systems, fraud checks, operational alerting, and AI systems that consume fresh business events, the budget is usually not owned by one component. It is shared across the whole path. If the broker injects jitter, every component after it has to live with that jitter.
In this benchmark, Iggy created more headroom at the broker layer and preserved a much tighter tail through the VeloDB ingestion path. That is exactly the shape we want from a streaming substrate for real-time analytics:
- enough throughput that the broker is not the first ceiling;
- low p99 and p99.9 latency, not just good averages;
- predictable freshness once events become queryable;
- a path that uses standard ingestion interfaces instead of custom benchmark-only shortcuts.
The last point is important. The benchmark used VeloDB Stream Load and standard connector paths. The result is not a microbenchmark trapped in the lab. It is closer to the architecture teams actually deploy.
The limitations
The benchmark is careful about its own boundaries, and those boundaries are worth keeping:
- The VeloDB backend was a 4-core demo configuration, not a scaled-out throughput test.
- The run used one region and one broker node.
- The Layer 2 test was steady-state and below saturation; it did not characterize overload behavior.
- The Iggy connector was still young and used a serial Stream Load path, while Kafka Connect used parallel tasks.
That last point cuts in an interesting direction. The Iggy end-to-end path was not advantaged by connector maturity. The broker was strong enough, and the tail predictable enough, that the full path still came out tighter.
The takeaway
The VeloDB benchmark is a useful snapshot of where streaming analytics is headed. The backend can ingest and make data queryable quickly. The broker layer is where latency predictability can either be preserved or lost.
In the broker-only layer, Iggy delivered roughly ~3x throughput and ~30x lower p99 latency than Kafka. In the full VeloDB ingestion path, the Iggy pipeline held p99.9 near 1.3 seconds, while the Kafka pipeline reached above 10 seconds.
For teams building systems where fresh data drives decisions, the result is the thing that matters most: not just faster ingestion, but a tighter freshness envelope.
That is the direction we are building for at LaserData Cloud: managed Apache Iggy for teams that need streaming infrastructure to be fast, open, and predictable enough for real-time analytics and AI-era data systems.