Observability
Full visibility.
Zero gaps.
Built-in metrics, heartbeats, logs, and audit trails for every deployment, out of the box. Redirect to your own OpenTelemetry stack when you need it. Alerts fire and resolve automatically.
3
telemetry types
4
alert types
365d
max retention
OTEL
native export
Architecture
Warden ships it. You consume it.
The Warden agent on each node continuously collects metrics, heartbeats, and logs, then pushes them to the LaserData control plane. Available immediately in the Console, API, or forwarded to your own OTEL-compatible endpoint.
Your Deployment Node
Warden ships telemetry
LaserData Control Plane
Console UI
Dashboard · Metrics · Logs
REST API
Supervisor API endpoints
Your OTEL Stack
Loki · Datadog · Elastic…
Metrics
Per-node. Per-runtime. Continuous.
Metrics are tagged by node and runtime (Iggy, Connectors) and available with time-range filtering from the Console or API.
What's Collected
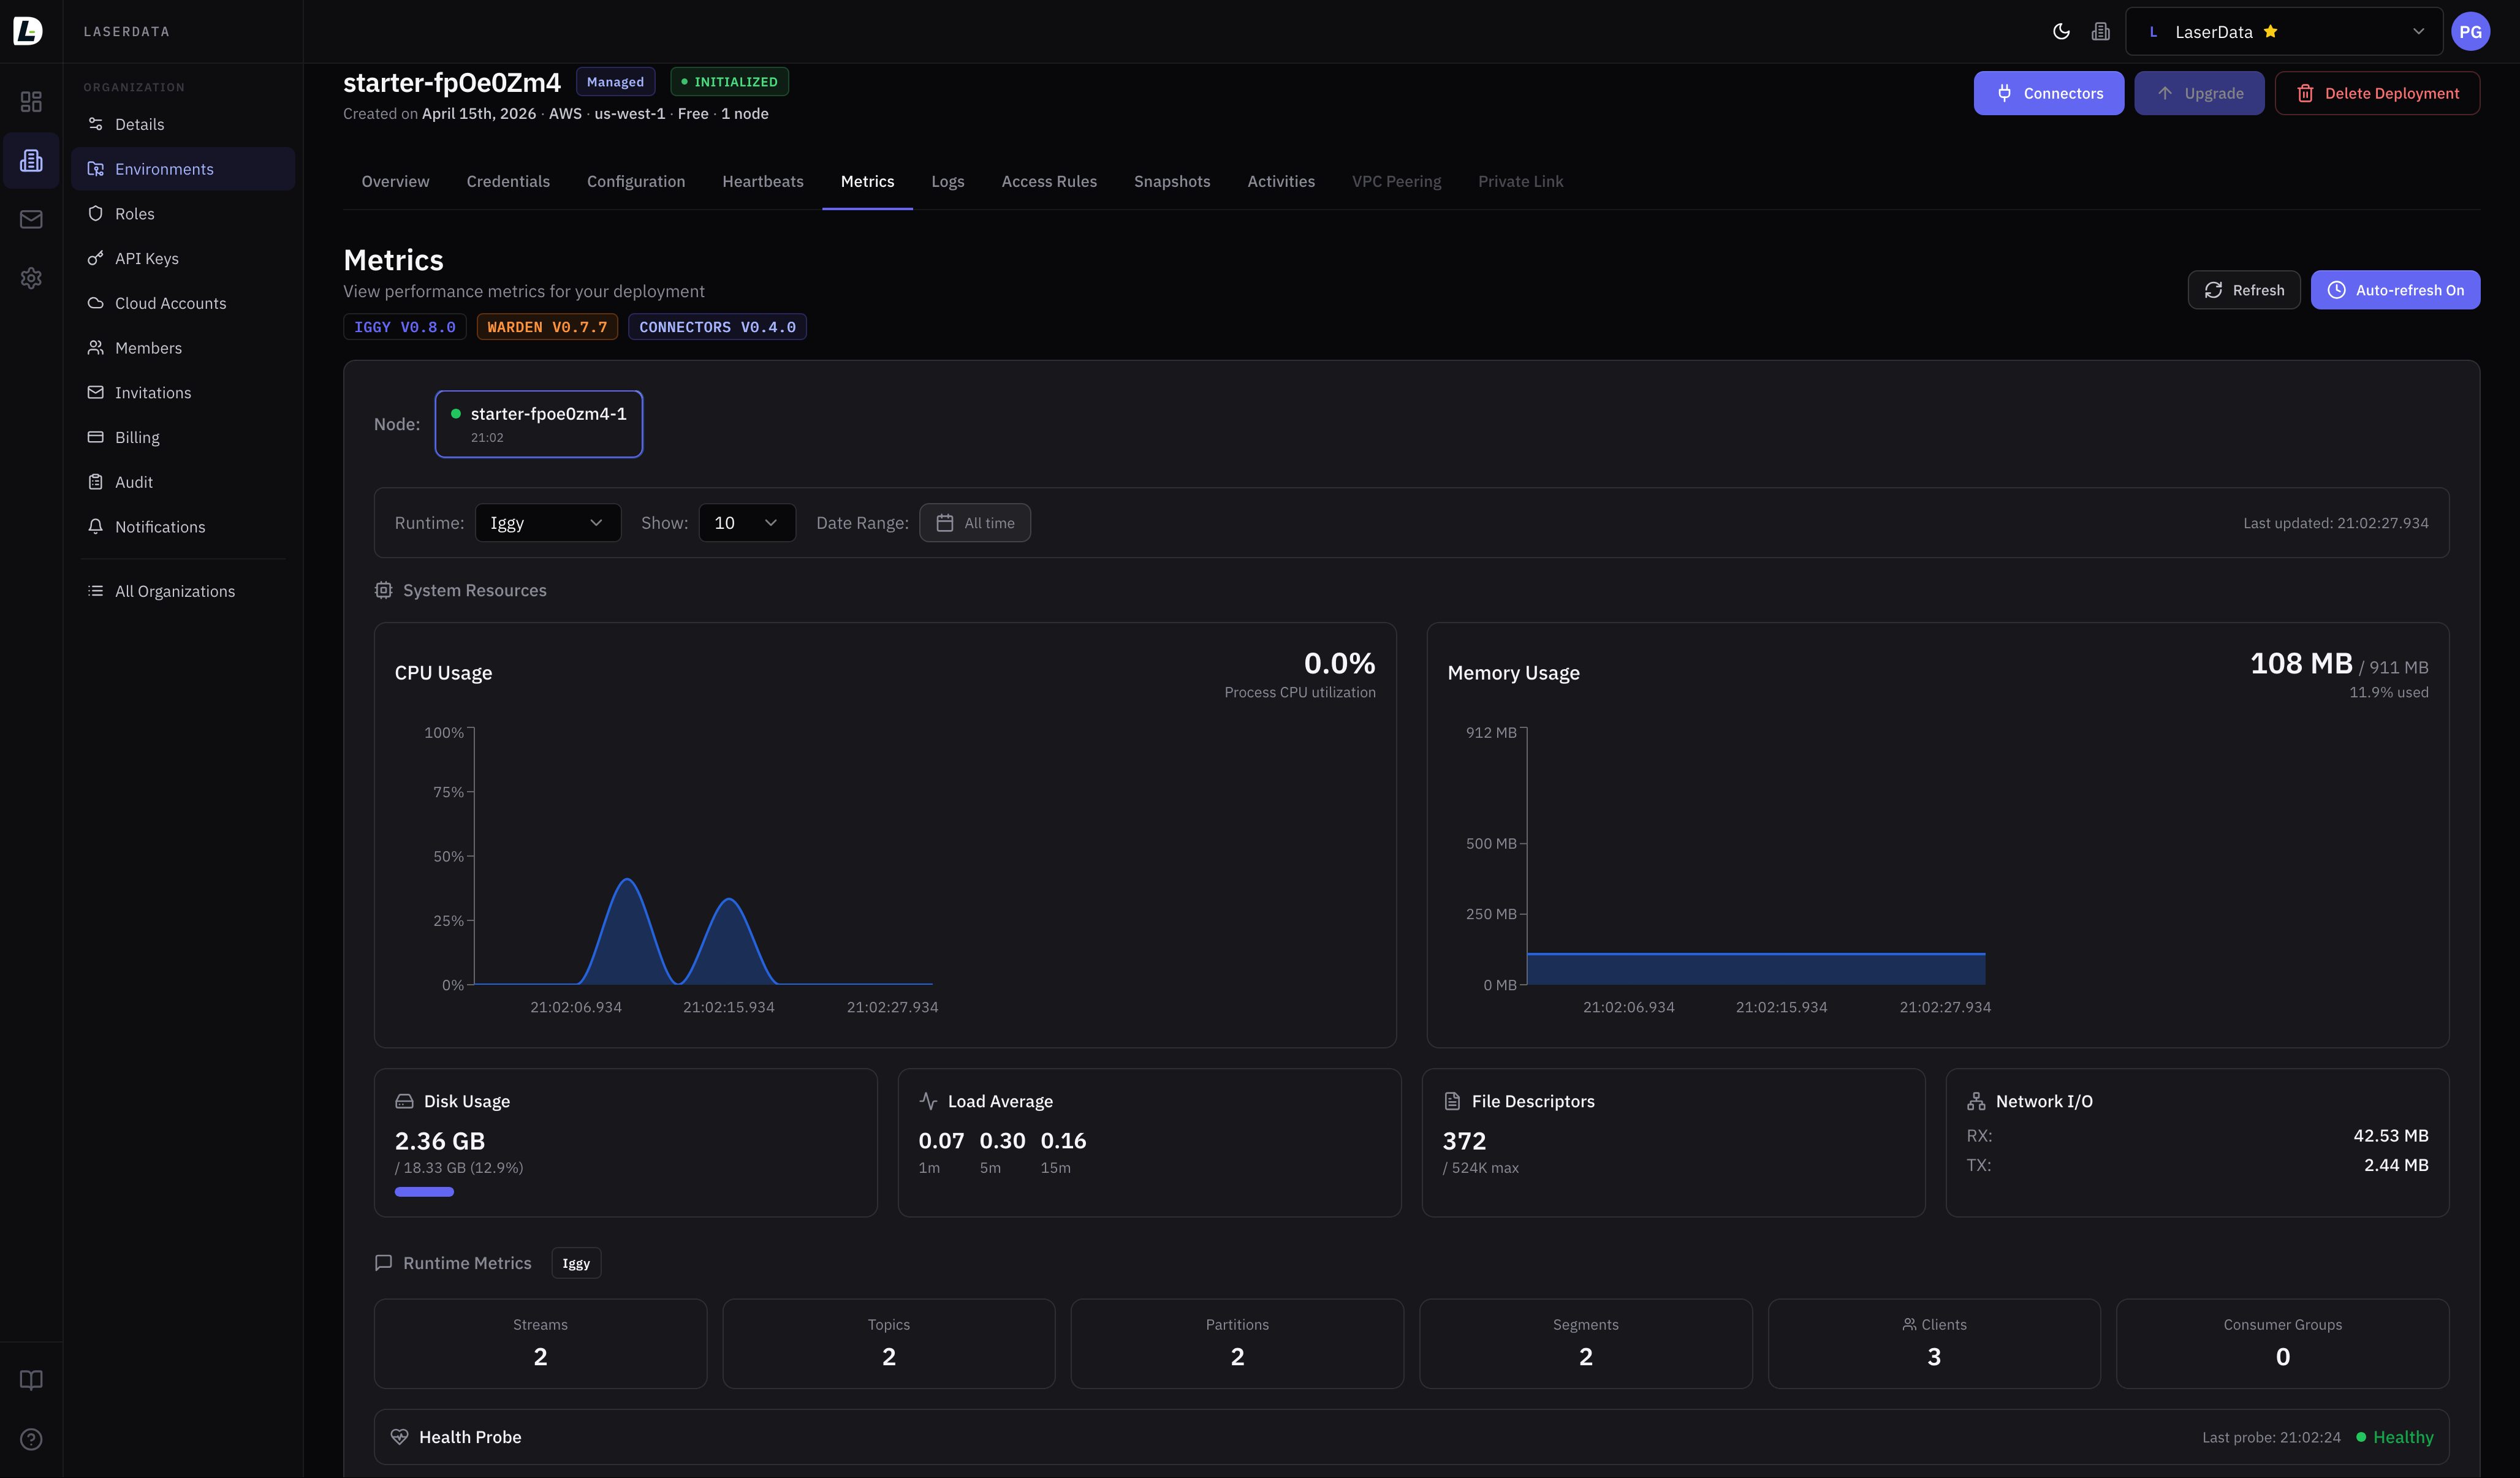
How to View
- 1Navigate to your deployment in the Console
- 2Open the Metrics tab
- 3Select a node and runtime
- 4Adjust time range to zoom in
API Example
# Get all metrics for a deployment
curl {supervisor_url}/deployments/{deployment_id}/metrics \
  -H "ld-api-key: YOUR_API_KEY"

# Get per-node Iggy metrics with time range
curl "{supervisor_url}/deployments/{deployment_id}/nodes/{node_id}/metrics/iggy?page=1&results=10&to=2026-02-01T00:00:00Z" \
  -H "ld-api-key: YOUR_API_KEY"
Heartbeats & Logs
Always-on health and log streams.
Heartbeats
Warden sends periodic heartbeats for each managed runtime (Iggy, Connectors). Heartbeats confirm the runtime is alive and responsive. Missing heartbeats beyond 120 seconds trigger a node_unreachable alert.
- Viewable per node and per runtime
- Time-range filtering for historical analysis
- Auto-resolves when node comes back online
curl {supervisor_url}/deployments/{deployment_id}/heartbeats \
  -H "ld-api-key: YOUR_API_KEY"
Logs
Centralized log collection from all runtimes on all nodes. Ingested by Warden and stored for querying with rich filters.
curl "{supervisor_url}/deployments/{deployment_id}/logs/iggy?page=1&results=10&level=error&message=* \
  -H "ld-api-key: YOUR_API_KEY"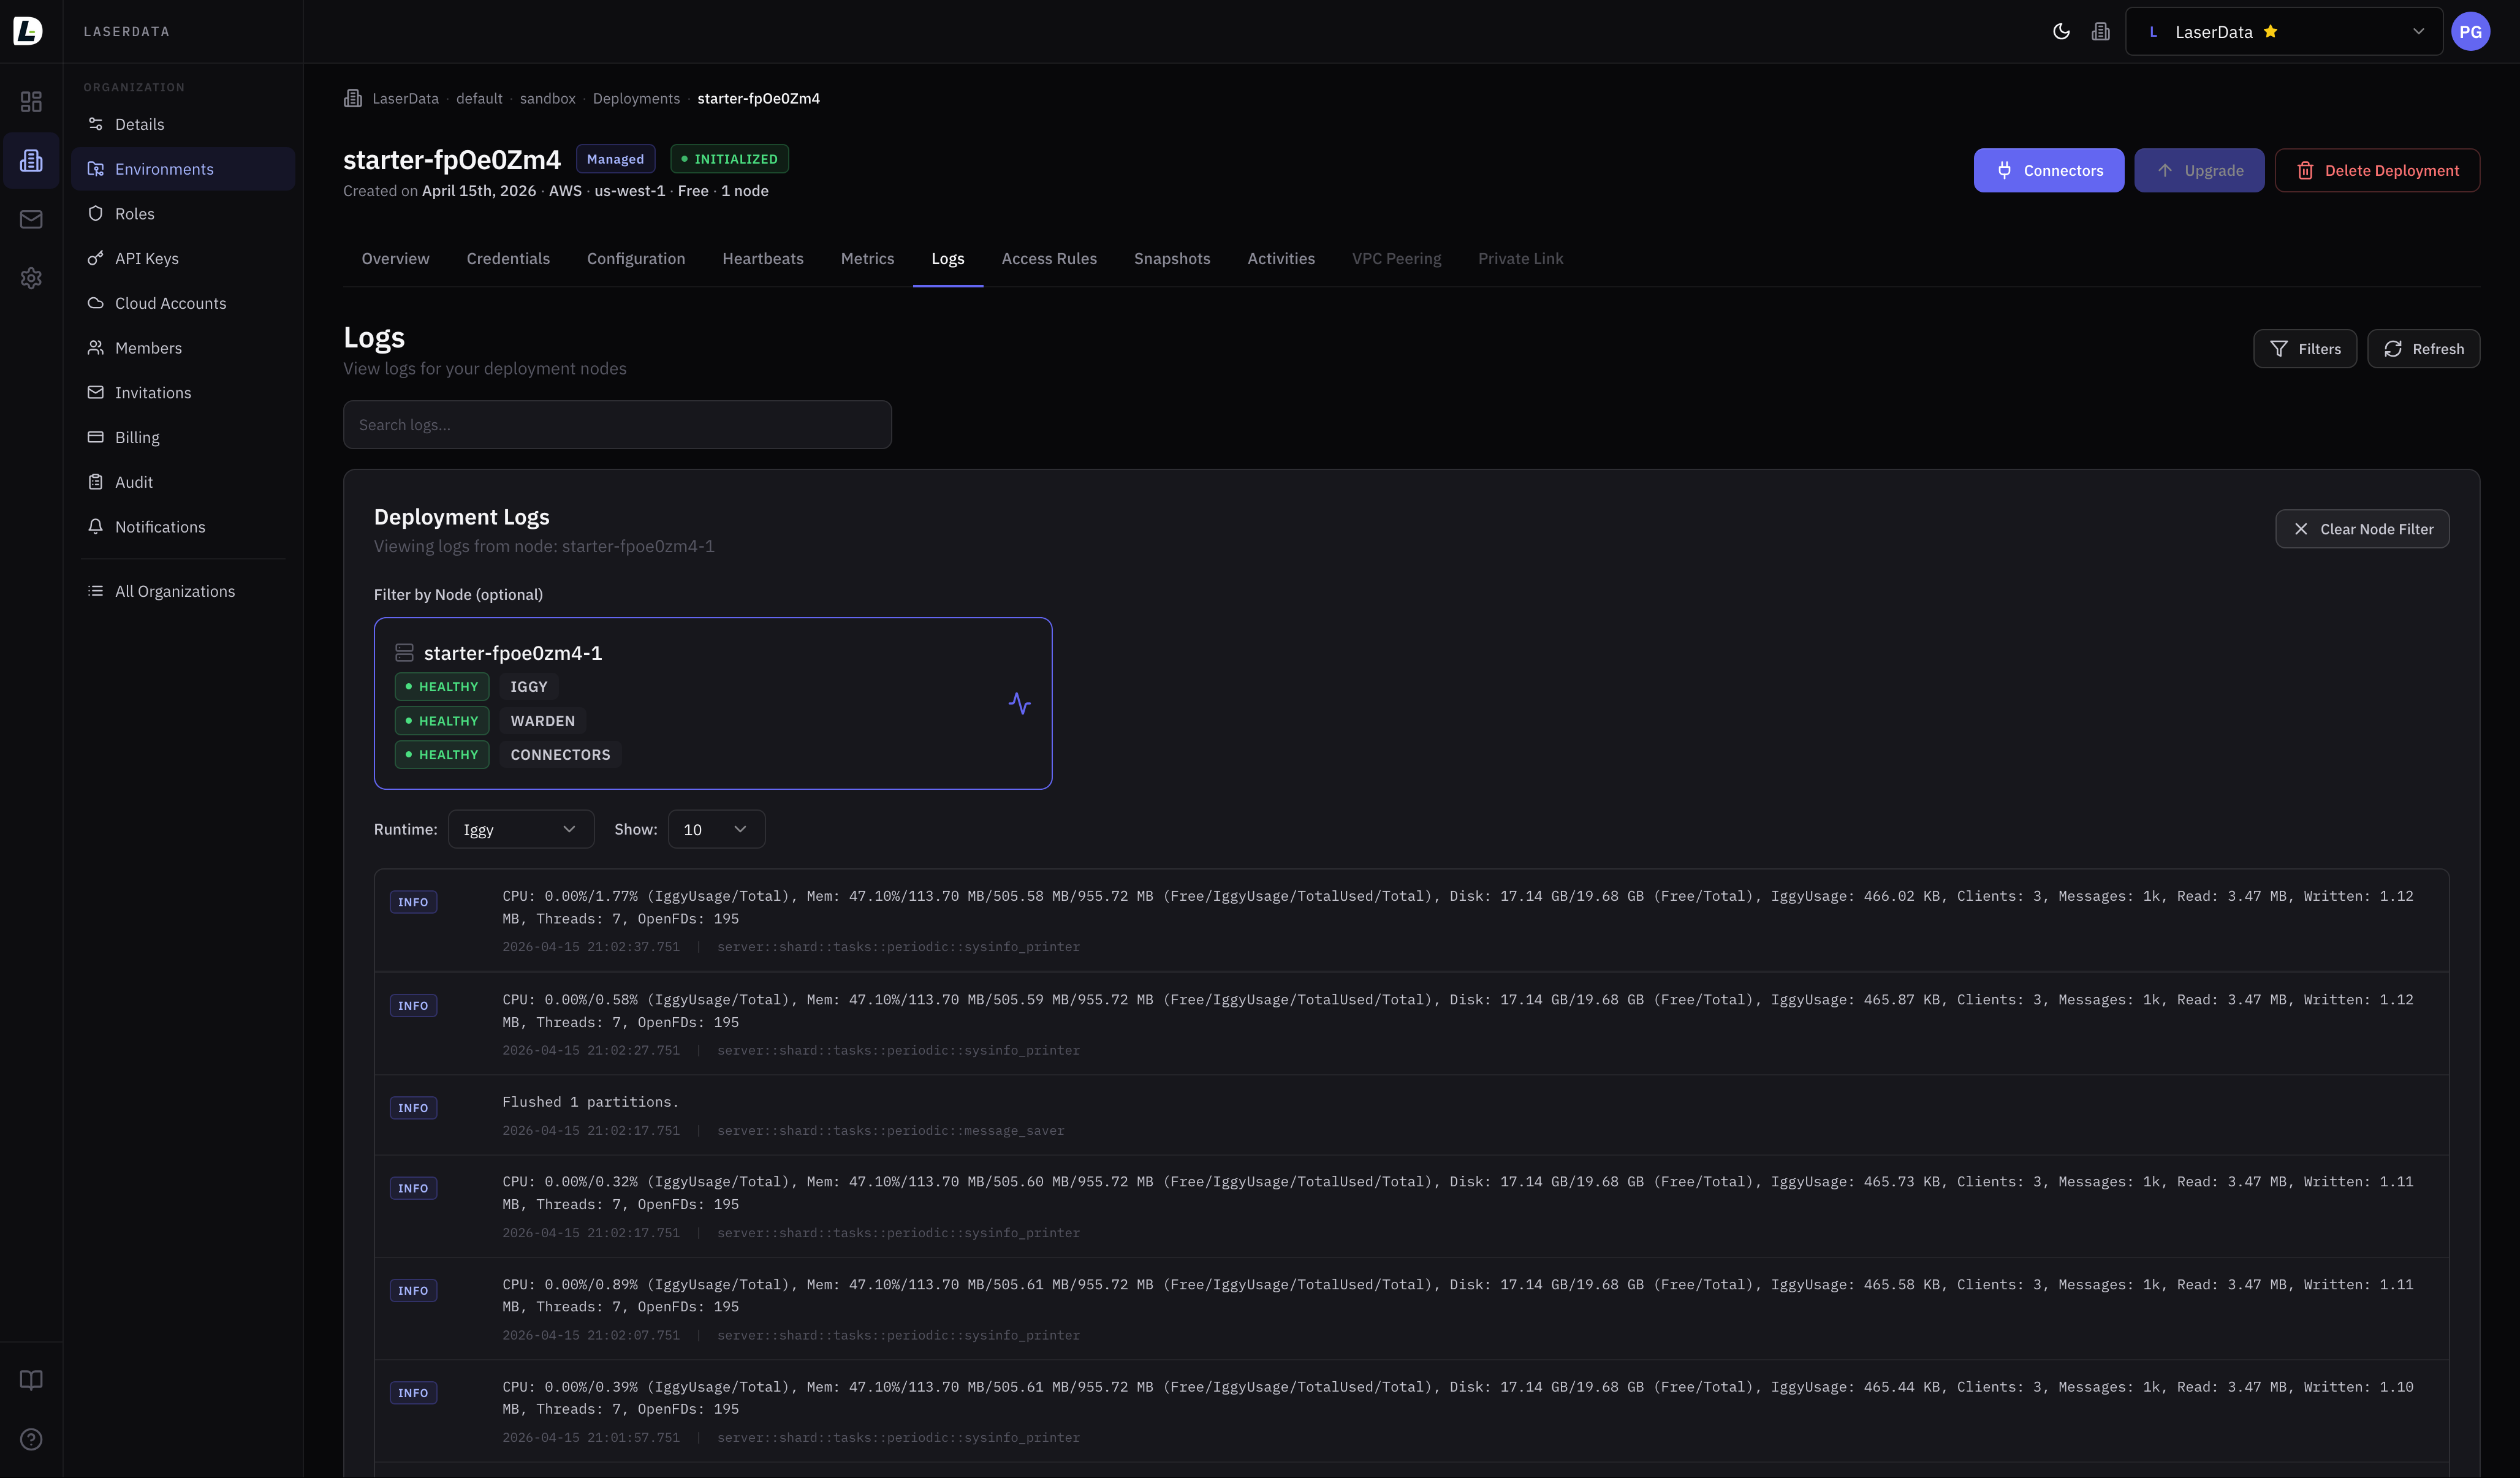
Alerts
Fire fast. Resolve automatically.
LaserData automatically monitors your deployments and fires alerts when thresholds are breached. Each alert has a matching resolution event. Alerts are deduplicated: no repeated noise while a condition persists.
high_cpu_usageCPU ≥ 80% (5-min window)Sustained high CPU usage on a node
cpu_usage_resolvedhigh_memory_usageMemory ≥ 90%Memory usage approaching capacity
memory_usage_resolvedhigh_disk_usageDisk ≥ 80%Disk usage approaching capacity
disk_usage_resolvednode_unreachableNo heartbeat for 120sNode stopped reporting heartbeats
node_reachableConnect alerts to your channels
Alerts are delivered via your configured notification channels via Slack, webhook, or email. Subscribe to specific event types and filter by deployment, environment, or division.
OpenTelemetry
Bring your own observability stack.
By default, all telemetry goes to LaserData Cloud. When you need data in your own systems (for compliance, privacy, or integration), redirect logs and traces to any OTEL-compatible endpoint.
How it works
When log redirection is enabled, Warden sends logs using the standard OTEL ExportLogsServiceRequest protocol. Traces use ExportTracesServiceRequest.
Configure via
Console deployment settings or by contacting support. Your OTEL endpoint can be internal or external, as long as it accepts standard OTEL protocol traffic.
OTEL Protocols Supported
ExportLogsServiceRequestType: Logs · gRPC: yes
ExportTracesServiceRequestType: Traces · gRPC: yes
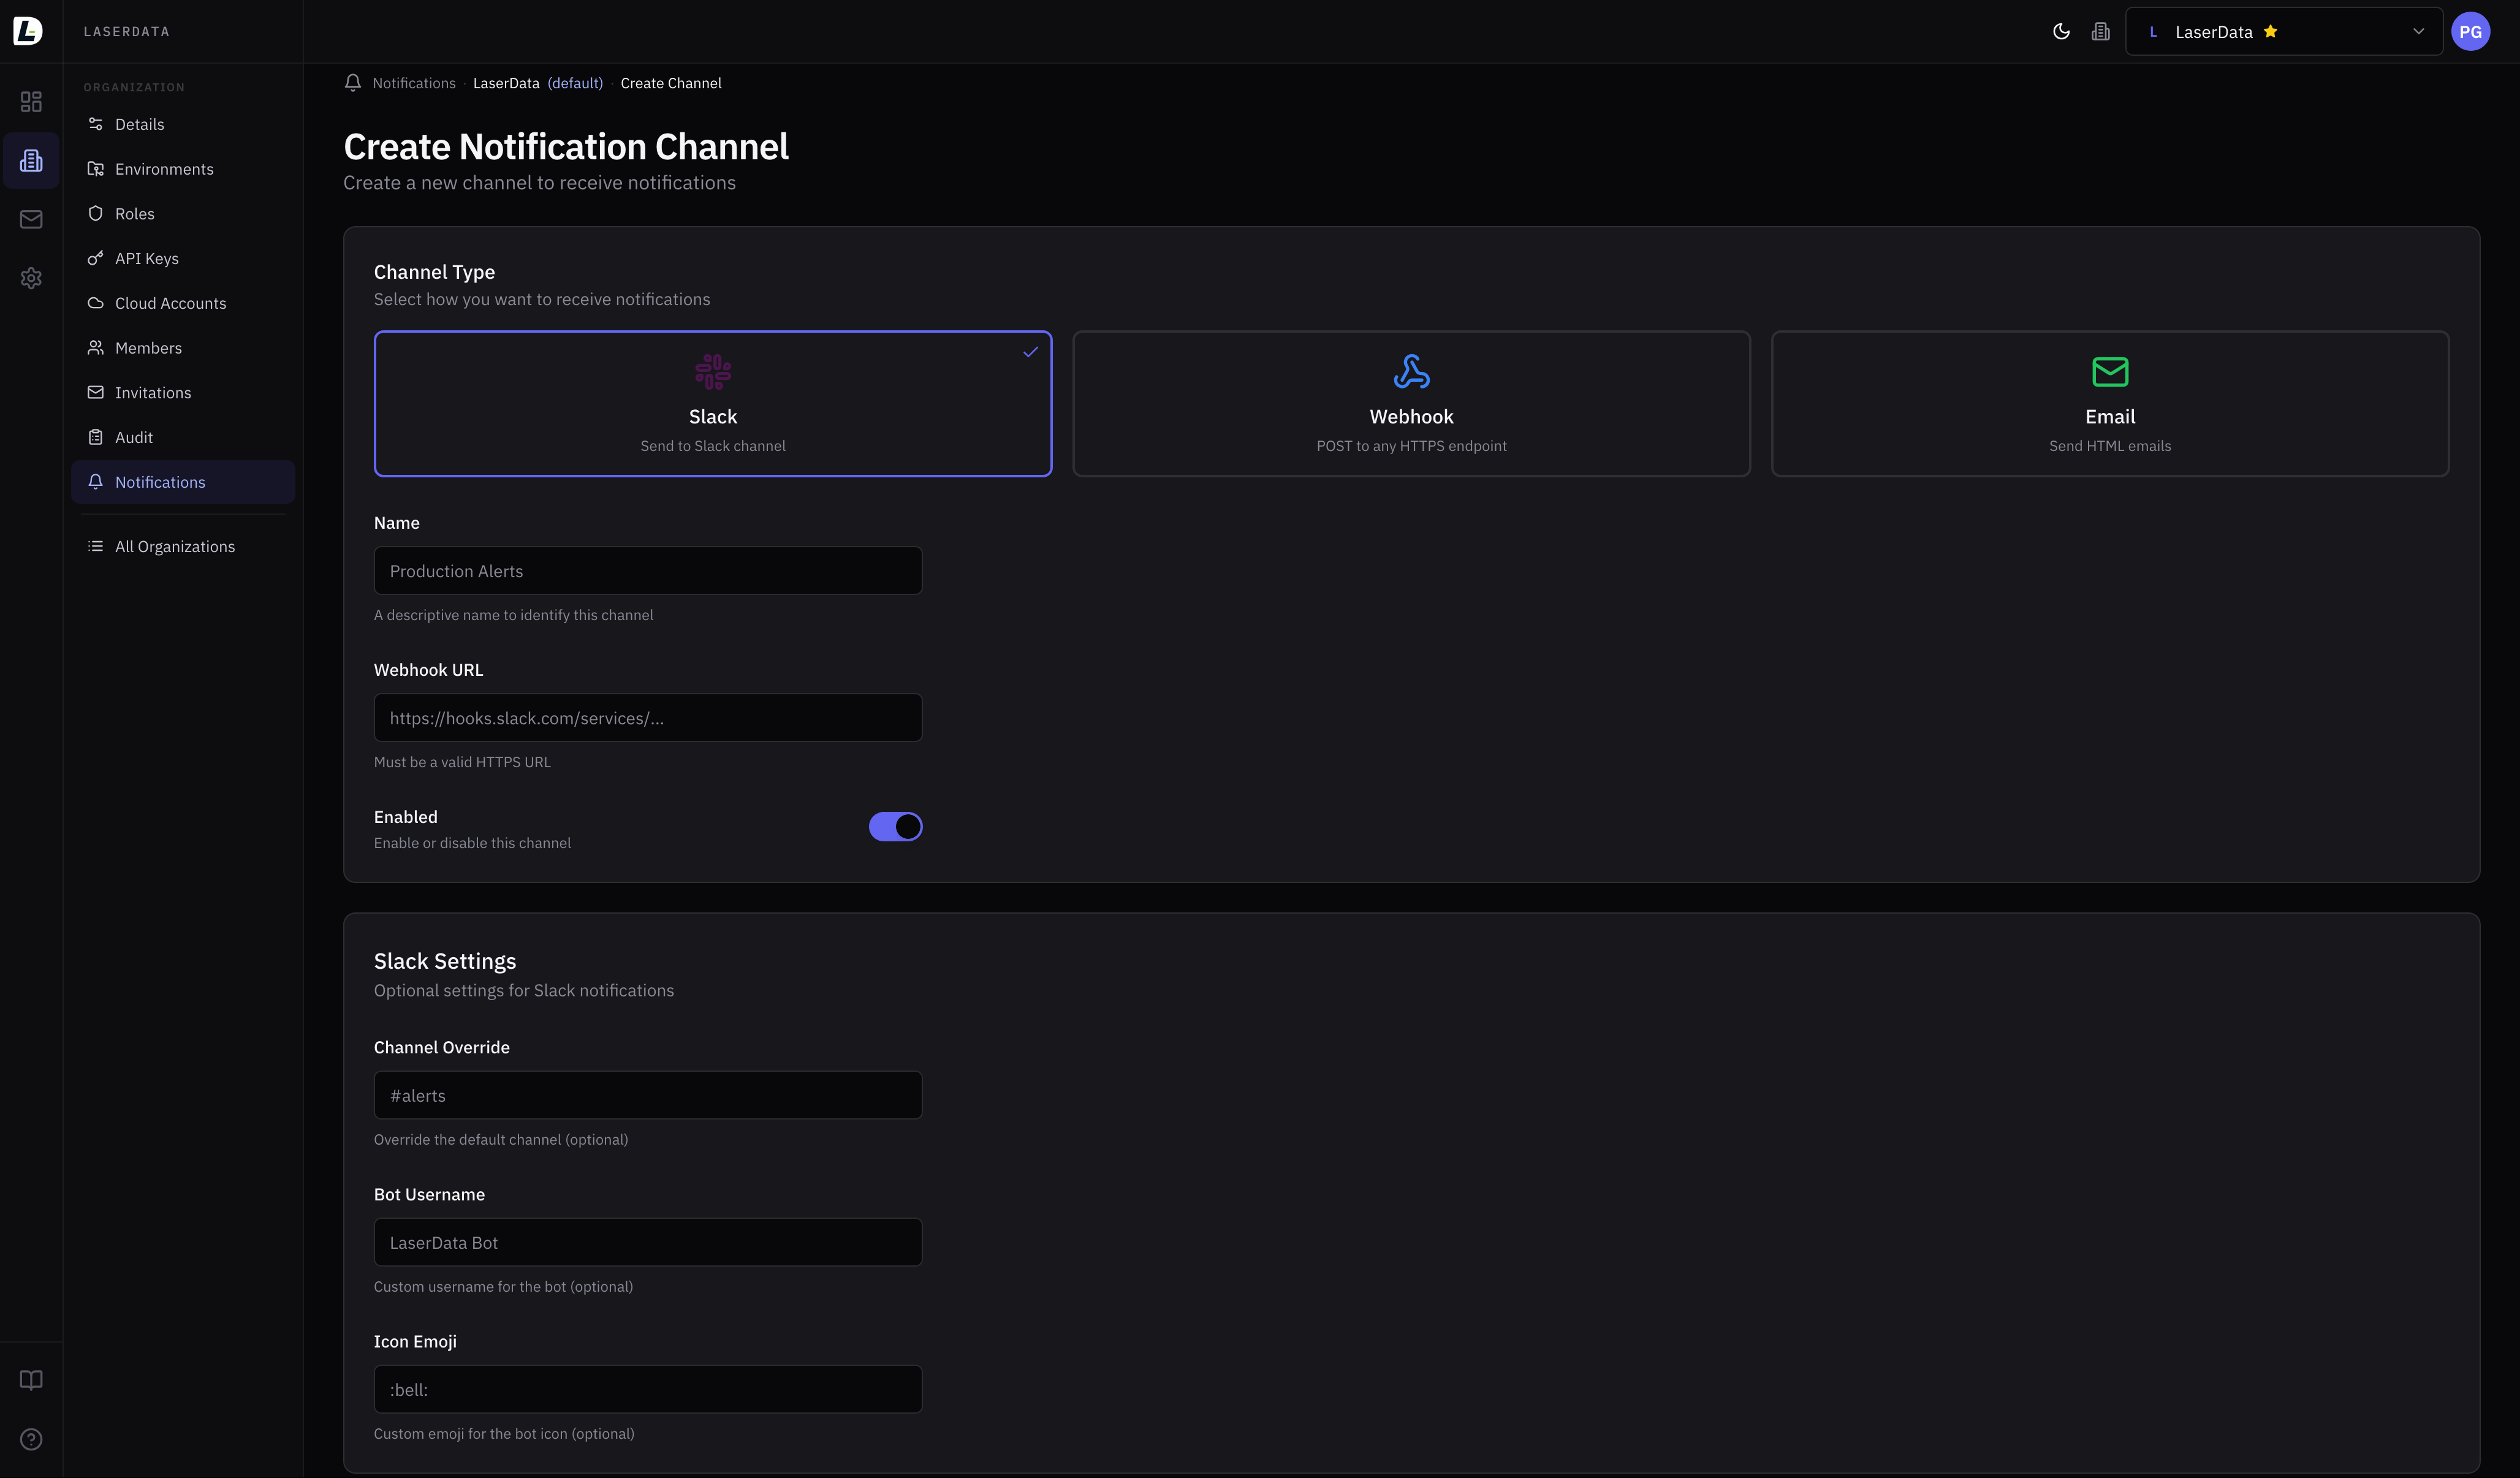
Notifications
Alert where your team lives.
Multi-channel delivery with per-subscription event filtering. Scope notifications to specific deployments, environments, or divisions. Experimental: APIs may change.
slackFormatted messages via incoming webhook
webhookJSON POST to any HTTPS endpoint
emailHTML email with subject and body
smsPhone delivery (coming soon)
How channels and subscriptions work
- 1Create a channel: define where (Slack URL, email, webhook endpoint)
- 2Add subscriptions: define which events trigger it, scoped to deployments/environments
- 3Test the channel: send a test notification to verify delivery
- 4Alerts fire automatically as events match your subscriptions
Plan limits
curl -X POST https://api.laserdata.cloud/tenants/{tenant_id}/channels \
  -H "ld-api-key: YOUR_API_KEY" \
  -H "Content-Type: application/json" \
  -d '{
    "channel": "slack",
    "name": "production-alerts",
    "destination": "https://hooks.slack.com/services/T00/B00/xxx",
    "settings": {
      "slack": { "channel": "#alerts", "username": "LaserData" }
    }
}'curl -X POST https://api.laserdata.cloud/tenants/{tenant_id}/channels/{channel_id}/subscriptions \
-H "ld-api-key: YOUR_API_KEY" \
-H "Content-Type: application/json" \
-d '{
"message_types": [
"node_unreachable",
"high_cpu_usage",
"high_memory_usage"
],
"scope_deployment_ids": [42]
}'
Audit & Compliance
Immutable. Encrypted. Tenant-isolated.
Every state-changing operation is recorded in an immutable audit log. Records cannot be modified or deleted. All PII is encrypted at rest.
Audit Logging
Every create, update, and delete across all resources. Includes actor info, resource context (tenant → division → environment → deployment), previous values on updates, and precise timestamps.
Read the docsAccess Logs
Who read sensitive data: user profiles, member listings, invitations, audit log reads, data exports. Includes request ID, actor, action, IP address, and User-Agent. Answers "who looked at this?"
Read the docsSecurity Events
Permission denied attempts and authentication failures captured with failure reason and request metadata. Designed for anomaly detection and incident response.
Read the docsGDPR & Data Protection
- PII encrypted at restEmails, names, IDP external IDs, invitation emails, all encrypted
- Data exportFull personal data export in JSON: profile, sessions, memberships, invitations
- Right to erasureFull account deletion: identities, memberships, invitations removed
- Audit retentionRetained under legitimate interest as permitted by GDPR
curl https://api.laserdata.cloud/account/export \
  -H "ld-api-key: YOUR_API_KEY"
Audit Log Retention
curl "https://audit.laserdata.cloud/audit/tenants/{tenant_id}?page=1&results=10" \
  -H "ld-api-key: YOUR_API_KEY"

# Response includes:
# type, name, author {id, name},
# division, environment, deployment,
# timestamp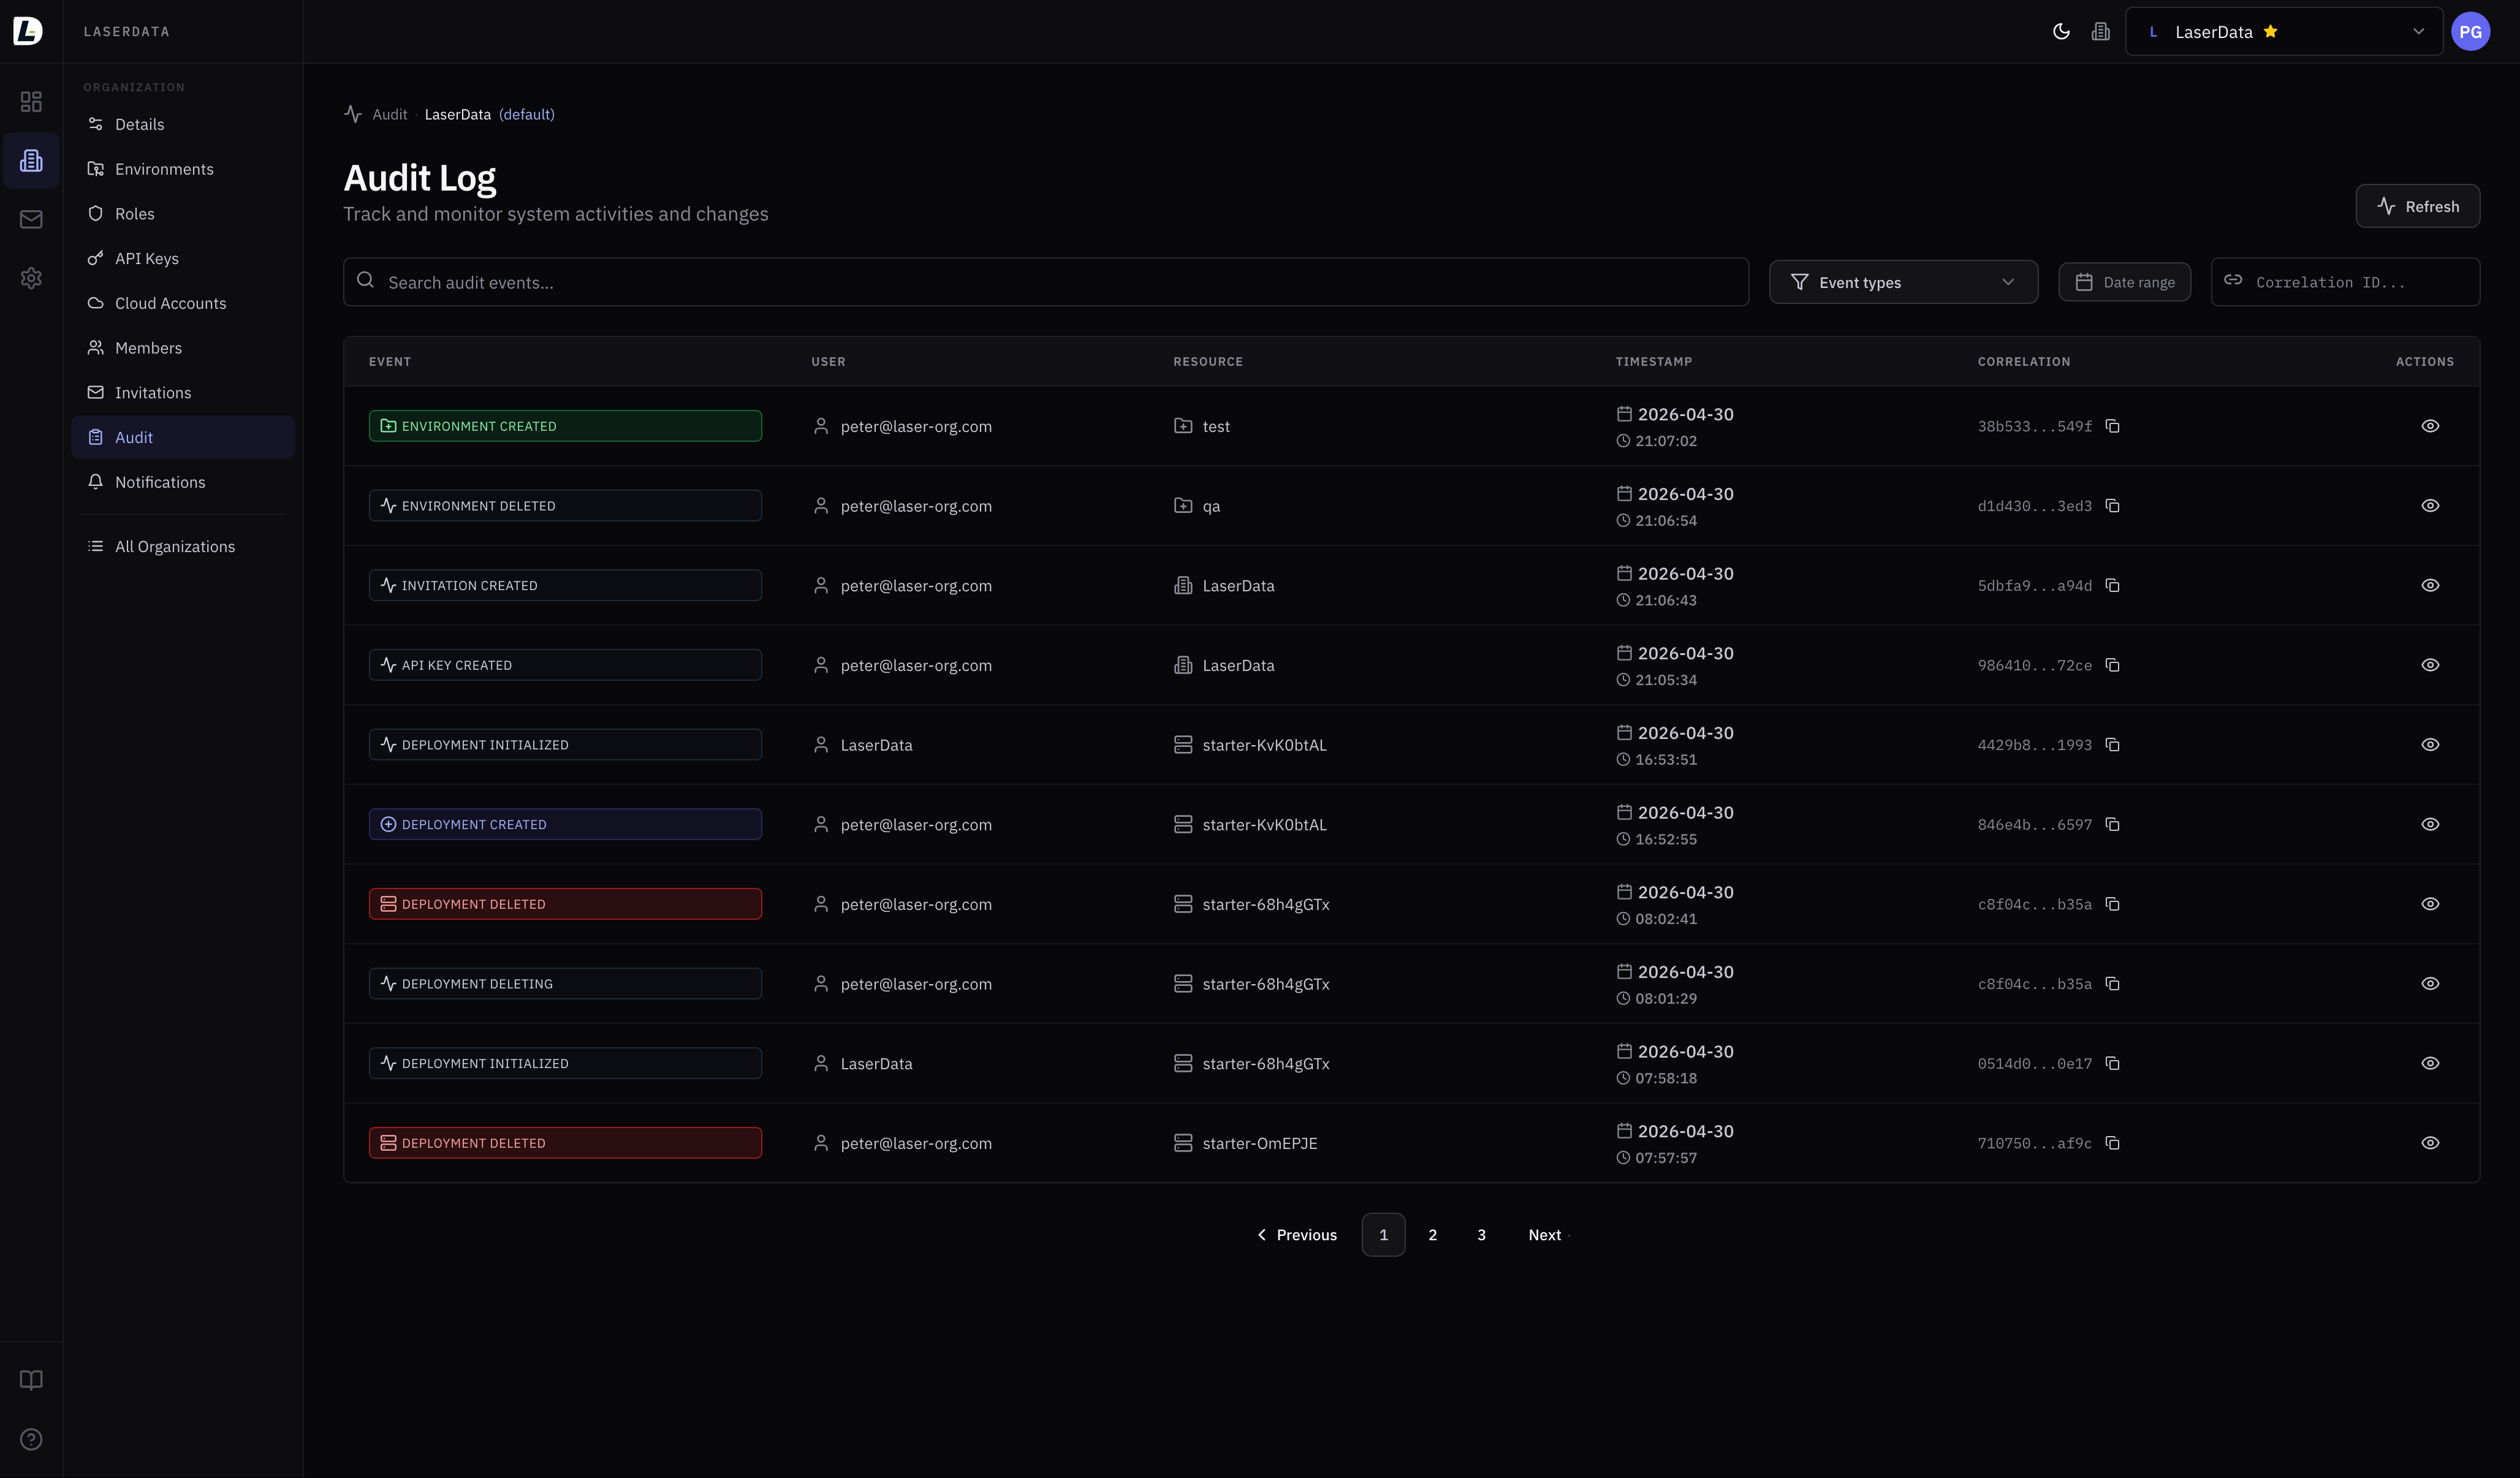
Retention
7 days free. Up to 365 days.
Every plan includes 7 days of telemetry retention at no extra cost. Extend up to 365 days; additional days beyond 7 are billed as a telemetry cost component. Configurable per deployment.
Required permission: deployment:telemetry:read (view) · deployment:telemetry:manage (configure retention)
Observability from day one.
Metrics, logs, heartbeats, alerts, and audit trails: all built in, no configuration required. Spin up a Free-tier deployment and see your infrastructure in full.